AWS Feed
Visualize and Analyze Data with Microsoft Power BI – New Course

Whizlabs presents you the opportunity to excel and equip yourself with the learning of Microsoft Power BI. The course will make sure that you get the edging knife in your business sphere and create your identity in the digital era. The revolutionary operating system is taking over the coding of our daily lives and learning it will help integrate into it better.
Microsoft is a brand that once held 95% of the world market share. As the years went by, its upgrading and development strategies paved its way for Cloud Computing and software services. Up to 2019, it was known to be the most held stock in index funds as well. It is well known that after AWS, Azure Cloud System introduced by Microsoft is leading the sphere.
The Need for Microsoft BI
Imagine yourself sitting in front of your computer with several tabs open. Each tab represents the data and analytics of every application and sub-application you use/create. Out of these tabs, your next 3-4 hours will be spent on segregating which data you want to view, finding that data and then wondering what sense to make out from the rest of the data. This is when Microsoft steps in and provides you with Microsoft Power BI.

Your 4 hours of research and the dissatisfaction and confusion left in the end will be addressed by this software. What Microsoft Power BI does is that it will collect all the software services, apps and web that you desire and connect every piece of data with each other. The end product is a visual projection of insights that you might know and the ones you should know.
Whizlabs Microsoft Power BI modules will help you learn these in a Jiffy. The introduction modules will describe the value and features of the software and give you an idea of how it presents itself from a user’s perspective.
Try our Free Test today: Analyzing Data with Microsoft Power BI (DA-100) Certification Free Test
The simple and one-click connection to your data sources and an easy visualization is something that holds Microsoft such a powerful hand in the digital sphere. Whizlabs is here with its course to train your powerful hand.
Working of Power BI
There are several parts or elements that go into the working of this software. The course will breakdown and simplify every element. You can create, share and customize business insights that help you explain as well as understand better.

A very useful element included in the Power BI is the report builder. Paginated reports are a form of reports that fit well on one page. The report will not be a booklet that complicates your information but a simple one-page wholesome analysis of your reports. Power BI is ‘THE ONLY’ tool for creating paginated reports.
Whizlabs course on Microsoft Power BI will help you with:
- How to get started with Power BI on the desktop
- Data modelling and visualizations
- Security and administration
- Case studies
- Practical use and application of the software
Uses of Power BI
Microsoft Power BI is useful no matter what role you play in project development. You can use Power BI to view reports or make reports. It will crunch your numbers and create your reports effortlessly. Publishing reports is another task that is done through this software. As ahead, you can monitor your reports through the app.
As a developer, Power BI will help you customize your applications and modify them. You can even build trial applications and see visuals that will help you finalize the end product.
The power BI includes the word ‘power’ for a reason. No matter what professional role you are playing, the software truly gives you the power of overview and insight. The statistics engagement in every report makes it much more communicative and impressive. Every part of the software has maximum and satisfactory use.
Watch a demo here: Microsoft Power BI Demo
Uses of Power BI as a Business User
The data culture that has been propagated has given space to decisions that are factual rather than opinionated. Business decisions are not taken in the air by predicting behaviour from your gut but through the statistical and rational analysis done by software. It makes sure that the data is presented in a compelling and much more readable visual manner. Its equipped with the term ‘Business Intelligence’.
- Reviewing and interacting with data is faster and helps you make the best business decisions.
- A hand on access to analysis, monitoring and exploration.
Whizlab course on Power BI will teach you how to develop a powerful BI Visual, create and build charts, use format options, R scripts and various data concepts.
Uses of Power BI as a Business Reporter
As a business reporter, Power BI will make it easier for you to connect and integrate the data. Moreover, it will create clean and specified data models and graphs. It’s one of the most effective tools if you are a data analyst. You need not open different data tabs and waste an hour integrating it. Microsoft BI has tools that will make an hours job worth minutes. Making of complex and intricate models is also a fingers job through this software.
Uses of Power BI as an Administrator
The software gives you various tools to even manage your data well and segregate them. It will auto-configure, monitor and provide you with provision organizational resources. The software offers 3 packages when it comes to this roll. There is (1) Global admin (2) Billing Admin (3) License admin (4) User Admin and (5) Power BI Admin.
The course will in such a case empower you with the knowledge of pushing data into the dataset, creating new data sets and make powerful templates while learning how to give and retain authentication access controls.
Why learn Microsoft Power BI and Take Certification?
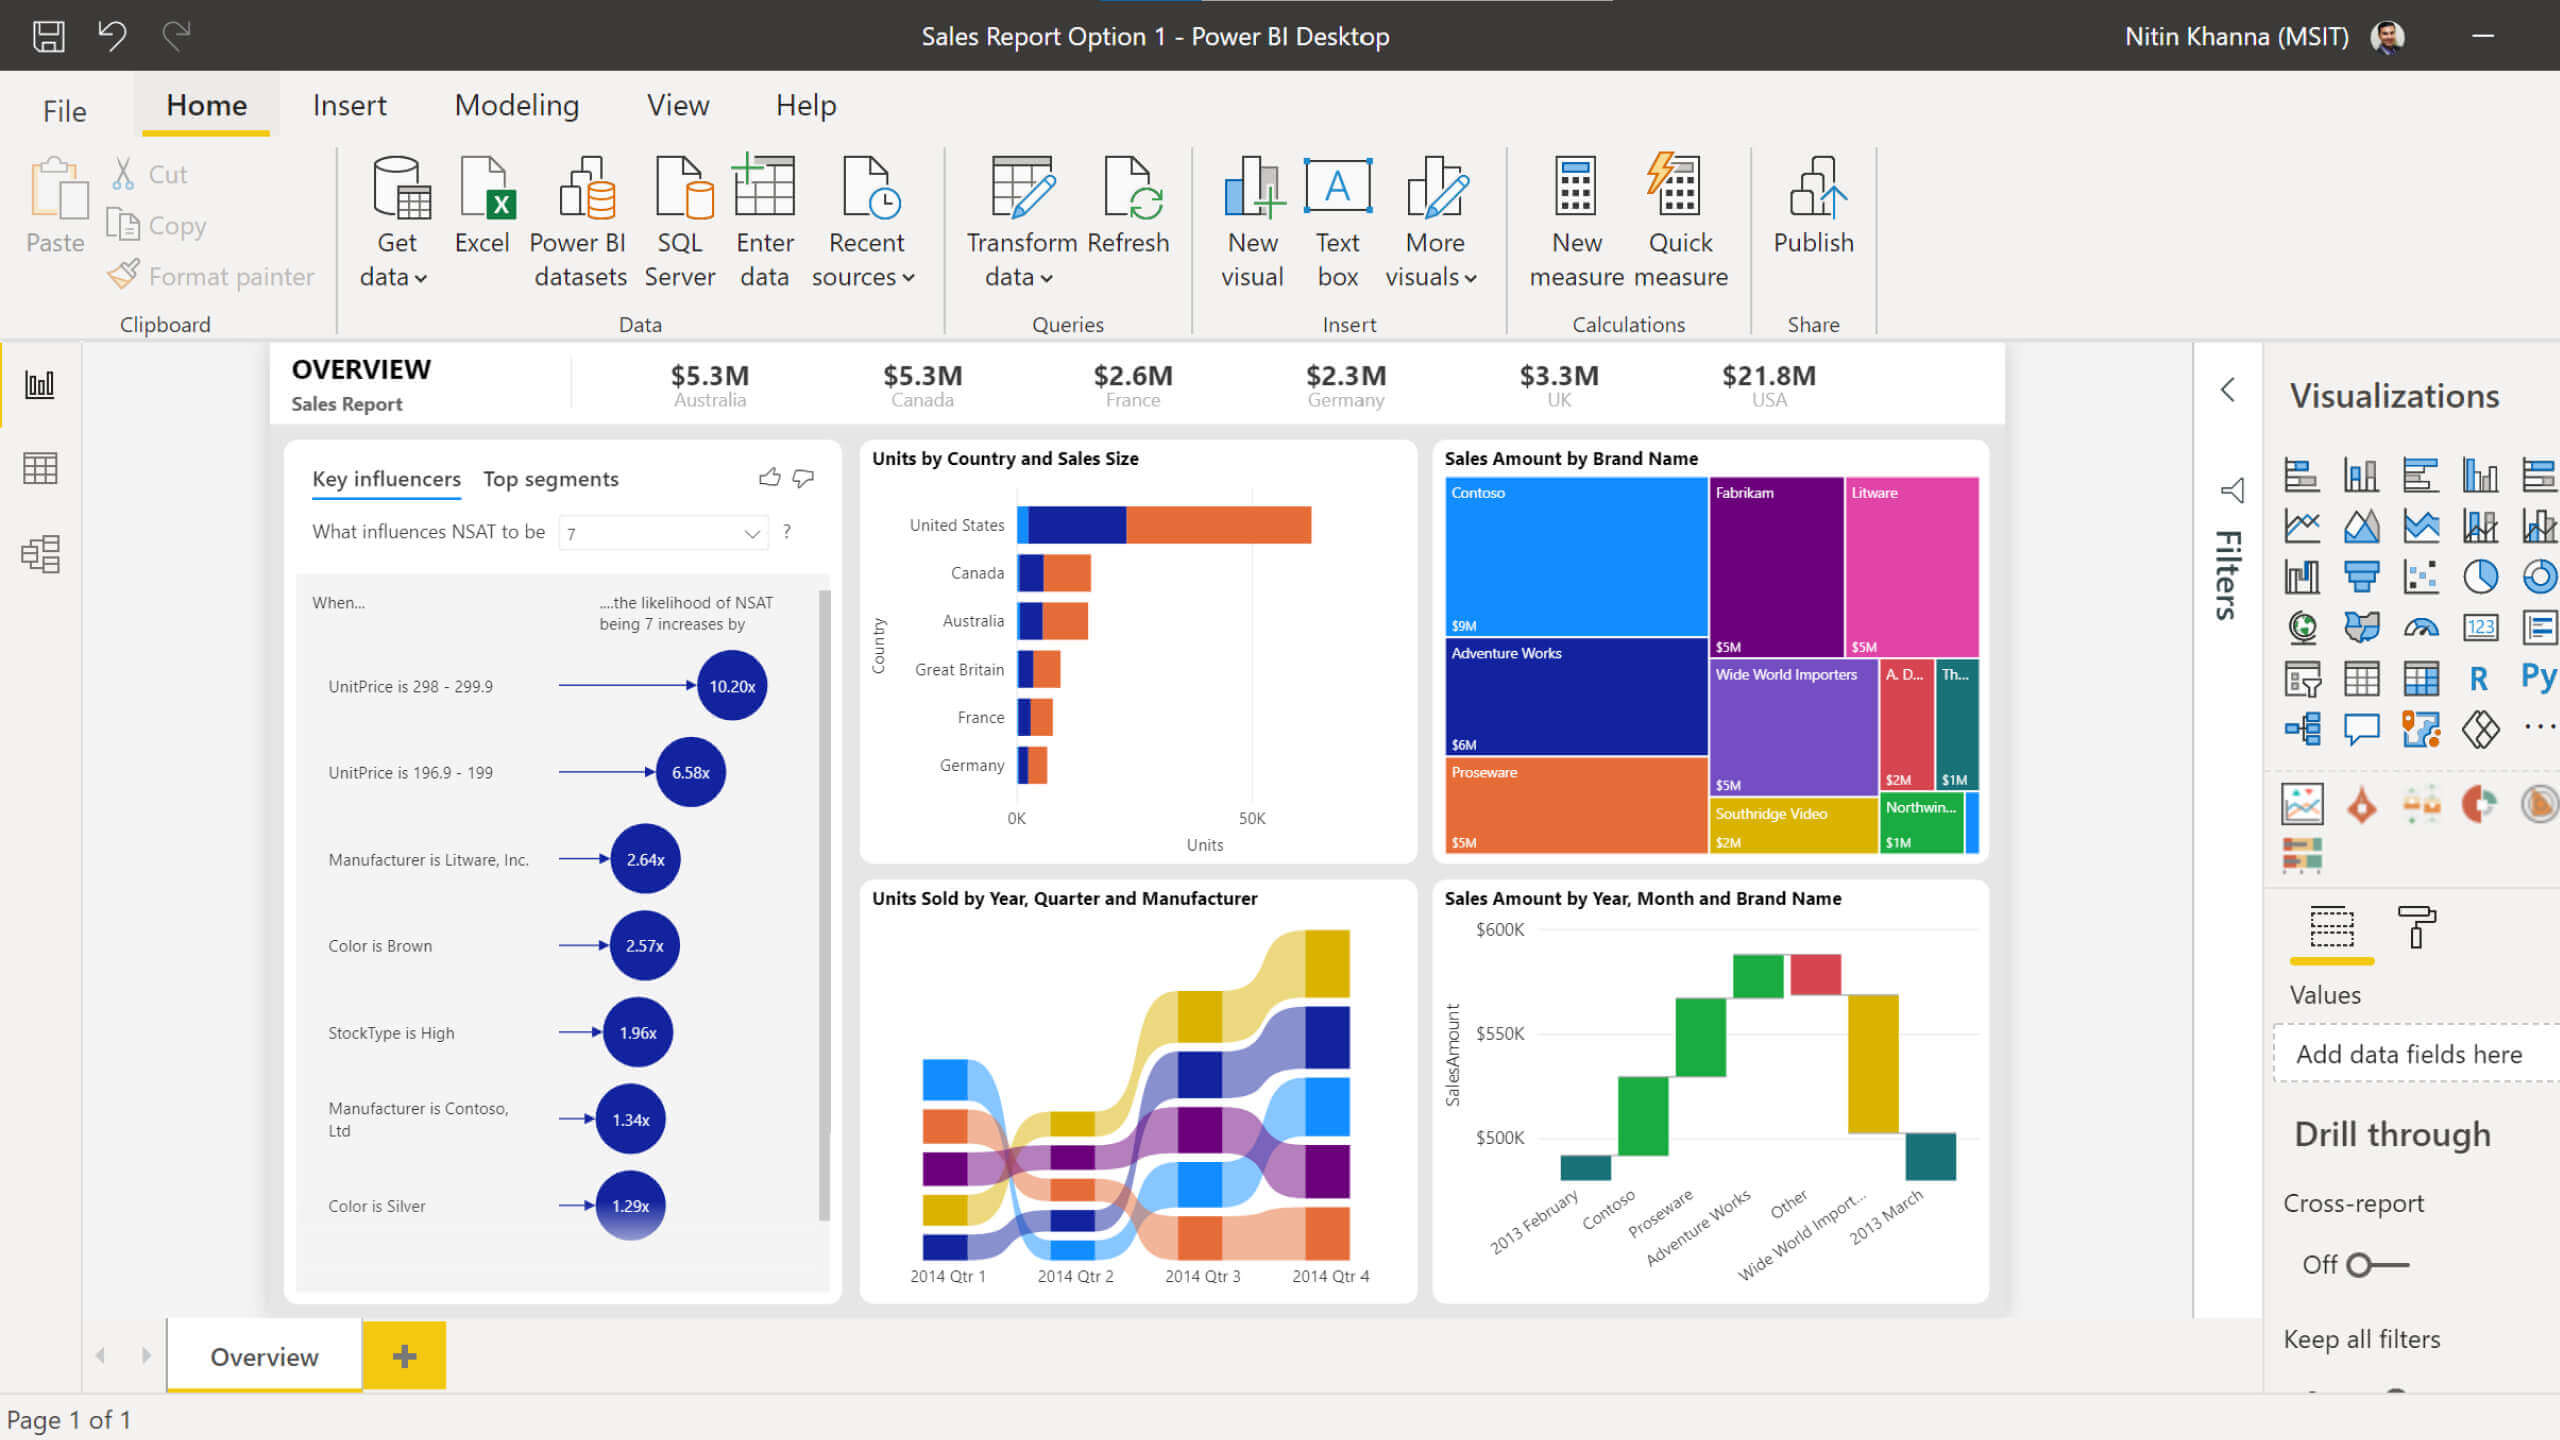
Interactive dashboards, consolidated key metrics and communicative reports are on the tip of the software. Power BI is the most needed software to engage with business data and segregate it from the data pool. It brings your data together in one place and provides an impressive organization. Its data modelling engine is the best and is high performance-based. It supports large-sized complex models and does not slow down, unlike excel. It comes with different packages of data visuals like Organizational chart, Infographic Designer, Pivot Slicer, Circle KPI Gauge, Text Enhancer, Calendar Visual etc.
Try our Practice Test before going for Certification today: Analyzing Data with Microsoft Power BI (DA-100) Certification – Practice Test
Is Microsoft power BI free?
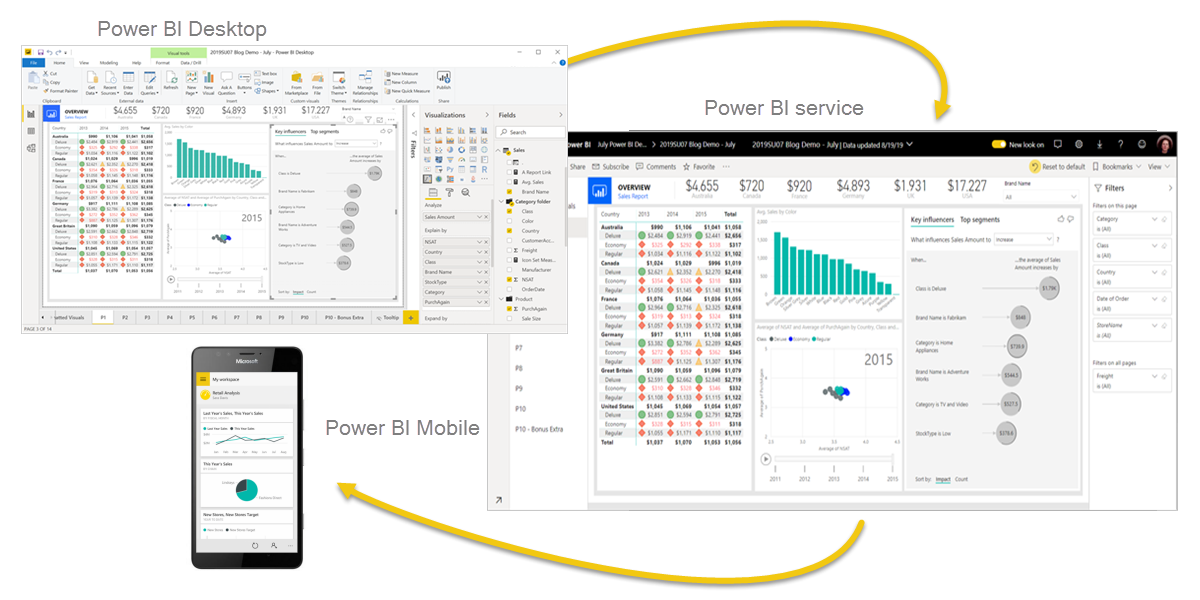
Power BI has three packages:
- Power BI Desktop: This free to every user and includes basic tools.
- Power BI Pro: It costs $9.99/per user/ per month. It gives you extra tools like a collaboration of data, data governance and many other features.
- Power BI Premium: The plan starts with $4,995 a month which offers cloud computing services.
The post Visualize and Analyze Data with Microsoft Power BI – New Course appeared first on Whizlabs Blog.