AWS Feed
Operating Lambda: Performance optimization – Part 2

In the Operating Lambda series, I cover important topics for developers, architects, and systems administrators who are managing AWS Lambda-based applications. This three-part series discusses performance optimization for Lambda-based applications.
Part 1 describes the Lambda execution environment lifecycle, and explains defining, measuring, and improving cold starts. This blog post explains the effect of the memory configuration on Lambda performance, and how to optimize static initialization code.
Memory and computing power
Memory is the principal lever available to Lambda developers for controlling the performance of a function. You can configure the amount of memory allocated to a Lambda function, between 128 MB and 10,240 MB. The Lambda console defaults new functions to the smallest setting and many developers also choose 128 MB for their functions.
However, 128 MB should usually only be used for the simplest of Lambda functions, such as those that transform and route events to other AWS services. If the function imports libraries or Lambda layers, or interacts with data loaded from Amazon S3 or Amazon EFS, it’s likely to be more performant with a higher memory allocation.
The amount of memory also determines the amount of virtual CPU available to a function. Adding more memory proportionally increases the amount of CPU, increasing the overall computational power available. If a function is CPU-, network- or memory-bound, then changing the memory setting can dramatically improve its performance.
Since the Lambda service charges for the total amount of gigabyte-seconds consumed by a function, increasing the memory has an impact on overall cost if the total duration stays constant. Gigabyte-seconds are the product of total memory (in gigabytes) and duration (in seconds). However, in many cases, increasing the memory available causes a decrease in the duration. As a result, the overall cost increase may be negligible or may even decrease.
For example, 1000 invocations of a function that computes prime numbers may have the following average durations at different memory levels:
| Memory | Duration | Cost |
| 128 MB | 11.722 s | $0.024628 |
| 256 MB | 6.678 s | $0.028035 |
| 512 MB | 3.194 s | $0.026830 |
| 1024 MB | 1.465 s | $0.024638 |
In this case, at 128 MB, the function takes 11.722 seconds on average to complete, at a cost of $0.024628 for 1,000 invocations. When the memory is increased to 1024 MB, the duration average drops to 1.465 seconds, so the cost is $0.024638. For a one-thousandth of a cent cost difference, the function has a 10-fold improvement in performance.
You can monitor functions with Amazon CloudWatch and set alarms if memory consumption is approaching the configured maximum. This can help identify memory-bound functions. For CPU-bound and IO-bound functions, monitoring the duration can often provide more insight. In these cases, increasing the memory can help resolve the compute or network bottlenecks.
Profiling functions with AWS Lambda Power Tuning
Choosing the memory allocated to Lambda functions is an optimization process that balances speed (duration) and cost. While you can manually run tests on functions by configuring different memory allocations and measuring the time taken to complete, the AWS Lambda Power Tuning tool allows you to automate the process.
This tool uses AWS Step Functions to run multiple concurrent versions of a Lambda function at different memory allocations and measure the performance. The input function is run in your AWS account, performing live HTTP calls and SDK interaction, to measure likely performance in a live production scenario. You can also implement a CI/CD process to use this tool to automatically measure the performance of new functions you deploy.
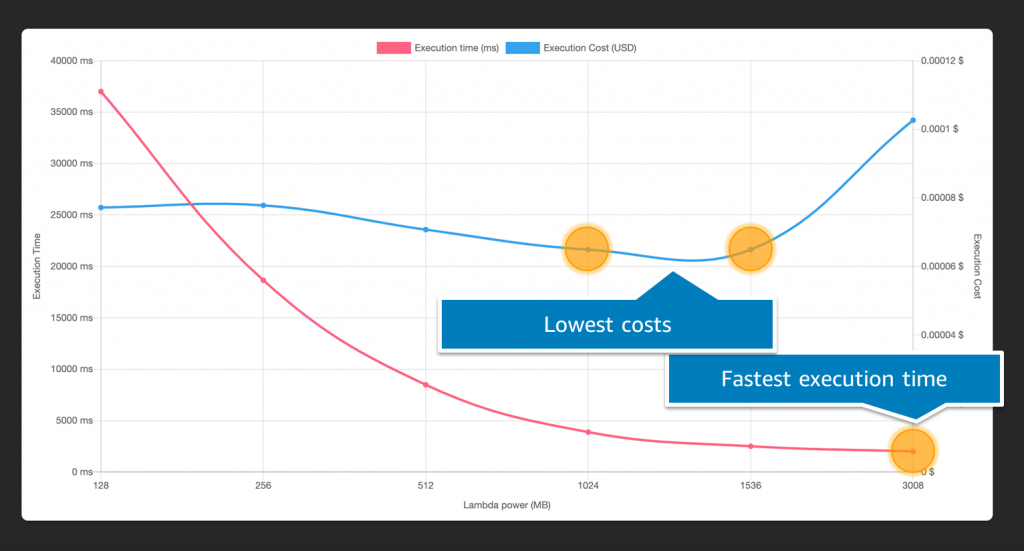
You can graph the results to visualize the performance and cost trade-off. In this example, you can see that a function has the lowest cost at 1024 MB and 1536 MB of memory, but the fastest execution at 3008 MB:
Generally, CPU-bound Lambda functions see the most benefit when memory increases, whereas network-bound see the least. This is because more memory provides greater computational capability, but it does not impact the response time of downstream services in network calls. Running the profiler on your functions provides insight into how your code performs at different memory allocations, allowing you to make better decisions about how to configure your functions.
You can also use AWS Cost Optimizer to automate a cost-performance analysis for all the Lambda functions in an AWS account. This service evaluates functions that have run at least 50 times over the previous 14 days, and provides automatic recommendations for memory allocation. You can opt in from the Cost Optimizer console to use this recommendation engine.
Optimizing static initialization
Static initialization happens before the handler code starts running in a function. This is the “INIT” code that happens outside of the handler. This code is often used to import libraries and dependencies, set up configuration and initialize connections to other services. In our analyses of Lambda performance across production invocations, data shows that the largest contributor of latency before function execution comes from INIT code. The section that developers can control the most can also have the biggest impact on the duration of a cold start.
The INIT code runs when a new execution environment is run for the first time, and also whenever a function scales up and the Lambda service is creating new environments for the function. The initialization code is not run again if an invocation uses a warm execution environment. This portion of the cold start is influenced by:
- The size of the function package, in terms of imported libraries and dependencies, and Lambda layers.
- The amount of code and initialization work.
- The performance of libraries and other services in setting up connections and other resources.
There are a number of steps that developers can take to optimize this portion of a cold start. If a function has many objects and connections, you may be able to rearchitect a single function into multiple, specialized functions. These are individually smaller and have less INIT code.
It’s important that functions only import the libraries and dependencies that they need. For example, if you only use Amazon DynamoDB in the AWS SDK, you can require an individual service instead of the entire SDK. Compare the following three examples:
// Instead of const AWS = require('aws-sdk'), use:
const DynamoDB = require('aws-sdk/clients/dynamodb') // Instead of const AWSXRay = require('aws-xray-sdk'), use:
const AWSXRay = require('aws-xray-sdk-core') // Instead of const AWS = AWSXRay.captureAWS(require('aws-sdk')), use:
const dynamodb = new DynamoDB.DocumentClient()
AWSXRay.captureAWSClient(dynamodb.service)
In testing, importing the DynamoDB library instead of the entire AWS SDK was 125 ms faster. Importing the AWS X-Ray core library was 5 ms faster than the X-Ray SDK. Similarly, when wrapping a service initialization, preparing a DocumentClient before wrapping showed a 140-ms gain. Version 3 of the AWS SDK for JavaScript now supports modular imports, which can further help reduce unused dependencies.
Static initialization is often a good place to open database connections to allow a function to reuse connections over multiple invocations to the same execution environment. However, you may have large numbers of objects that are only used in certain execution paths in your function. In this case, you can lazily load variables in the global scope to reduce the static initialization duration.
Global variables should be avoided for context-specific information per invocation. If your function has a global variable that is used only for the lifetime of a single invocation and is reset for the next invocation, use a variable scope that is local to the handler. Not only does this prevent global variable leaks across invocations, it also improves the static initialization performance.
Comparing the effect of global scope
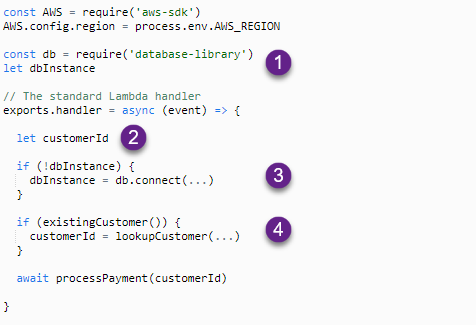
In this example, the Lambda function looks up a customer ID from a database to process a payment. There are several issues:
- Private data that is only used per invocation should be defined within the handler. Global variables retain their value between invocations in the same execution environment.
- Libraries should be defined in the initialization code outside of the handler, so they are loaded once when the execution environment is created. This implementation causes the library to be loaded on every invocation, slowing performance.
- The connection logic should also be managed in the initialization handler, and any connection strings containing secrets should not be stored in plaintext.
- This type of logic can lead to unintended effects. If the existingCustomer function returns false, the customerId retains the value from the last invocation of the function. As a result, the wrong customer is charged.
The next example uses scoping correctly to resolve these issues:
- Libraries are defined in the initialization section and are loaded once per execution environment. The instance variable is lazily loaded.
- The customerId is defined in the handler so the variable is erased when the function exits with no risk of data leakage between functions.
- The dbInstance connection is made only on the first invocation, using lazy loading.
- The customerId value equals null if the existingCustomer function returns false.
Static initialization and Provisioned Concurrency
In on-demand Lambda functions, the static initializer is run after a request is received but before the handler is invoked. This results in latency for the requester and contributes to the overall cold start duration. While you can optimize the static initializer as shown in the preceding section, there are times where you may need to perform large amounts of work here, and cannot avoid a long INIT duration.
Provisioned Concurrency allows you to prepare execution environments before receiving traffic, making it ideal for functions with complex and lengthy INIT code. In this case, the duration of the INIT code does not impact the overall performance of an invocation.
While all Provisioned Concurrency functions start more quickly than the existing on-demand Lambda execution style, this is particularly beneficial for some function profiles. Runtimes like C# and Java have much slower initialization times than Node.js or Python, but faster execution times once initialized. With Provisioned Concurrency turned on, these runtimes benefit from both the consistent low latency of the function’s start-up and the performance during execution.
Conclusion
This post is the second in a 3-part series on performance optimization in Lambda. It explains the effect of the memory configuration on Lambda performance, and why the memory setting also controls the compute power and networking I/O available to a function. It discusses how to profile Lambda functions to find your preferred configuration for balancing cost and performance.
I also cover how static initialization code works and how you can optimize this code to reduce cold start latency. I show how the function package size, library performance, and modular imports can influence latency.
Part 3 will cover function architecture and best practices that can help improve the performance of your Lambda functions.
For more serverless learning resources, visit Serverless Land.


