AWS Feed
Field Notes: Monitor IBM Db2 for Errors Using Amazon CloudWatch and Send Notifications Using Amazon SNS
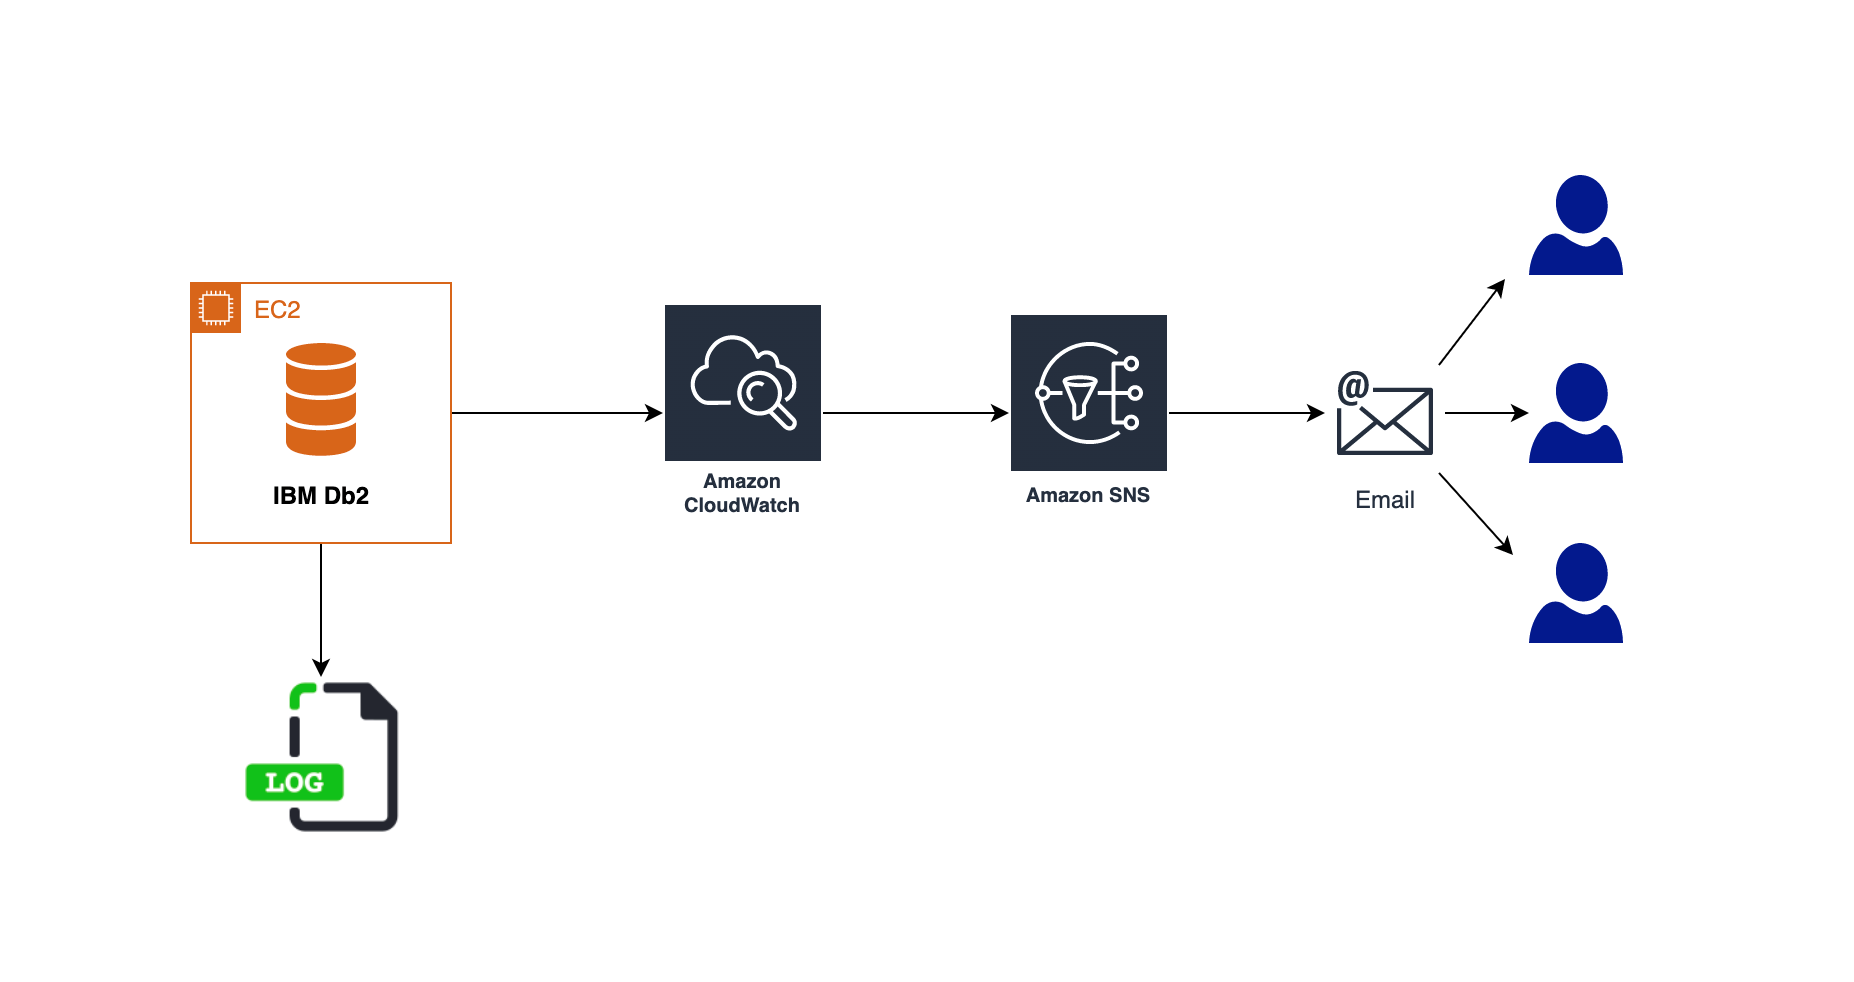
Monitoring a is crucial function to be able to detect any unanticipated or unknown access to your data in an IBM Db2 database running on AWS. You also need to monitor any specific errors which might have an impact on the system stability and get notified immediately in case such an event occurs. Depending on the severity of the events, either manual or automatic intervention is needed to avoid issues.
While it is possible to access the database logs directly from the Amazon EC2 instances on which the database is running, you may need additional privilege to access the instance, in a production environment. Also, you need to write custom scripts to extract the required information from the logs and share with the relevant team members.
In this post, we use Amazon CloudWatch log Agent to export the logs to Amazon CloudWatch Logs and monitor the errors and activities in the Db2 database. We provide email notifications for the configured metric alerts which may need attention using Amazon Simple Notification Service (Amazon SNS).
Overview of solution
This solution covers the steps to configure a Db2 Audit policy on the database to capture the SQL statements which are being run on a particular table. This is followed by installing and configuring Amazon CloudWatch log Agent to export the logs to Amazon CloudWatch Logs. We set up metric filters to identify any suspicious activity on the table like unauthorized access from a user or permissions being granted on the table to any unauthorized user. We then use Amazon Simple Notification Service (Amazon SNS) to notify of events needing attention.
Similarly, we set up the notifications in case of any critical errors in the Db2 database by exporting the Db2 Diagnostics Logs to Amazon CloudWatch Logs.

Figure 1 – Solution Architecture
Prerequisites
You should have the following prerequisites:
- Ensure you have access to the AWS console and CloudWatch
- Db2 database running on Amazon EC2 Linux instance. Refer to the Db2 Installation methods from the IBM documentation for more details.
- A valid email address for notifications
- A SQL client or Db2 Command Line Processor (CLP) to access the database
- Amazon CloudWatch Logs agent installed on the EC2 instances
Refer to the Installing CloudWatch Agent documentation and install the agent. The setup shown in this post is based on a RedHat Linux operating system. You can run the following commands as a root user to install the agent on the EC2 instance, if your OS is also based on the RedHat Linux operating system.
cd /tmp
wget https://s3.amazonaws.com/amazoncloudwatch-agent/redhat/amd64/latest/amazon-cloudwatch-agent.rpm
sudo rpm -U ./amazon-cloudwatch-agent.rpm
- Create an IAM role with policy CloudWatchAgentServerPolicy.
This IAM role/policy is required to run CloudWatch agent on EC2 instance. Refer to the documentation CloudWatch Agent IAM Role for more details. Once the role is created, attach it to the EC2 instance profile.
Setting up a Database audit
In this section, we set up and activate the db2 audit at the database level. In order to run the db2audit command, the user running it needs SYSADM authority on the database.
First, let’s configure the path to store an active audit log where the main audit file will be created, and archive path where it will be archived using the following commands.
db2audit configure datapath /home/db2inst1/dbaudit/active/
db2audit configure archivepath /home/db2inst1/dbaudit/archive/
Now, let’s set up the static configuration audit_buf_sz size to write the audit records asynchronously in 64 4K pages. This will ensure that the statement generating the corresponding audit record does not wait until the record is written to disk.
db2 update dbm cfg using audit_buf_sz 64Now, create an audit policy on the WORKER table, which contains sensitive employee data to log all the SQL statements being executed against the table and attach the policy to the table as follows.
db2 connect to testdb
db2 "create audit policy worktabpol categories execute status both error type audit"
db2 "audit table sample.worker using policy worktabpol"
Finally, create an audit policy to audit and log the SQL queries run by the admin user authorities. Attach this policy to dbadm, sysadm and secadm authorities as follows.
db2 "create audit policy adminpol categories execute status both,sysadmin status both error type audit"
db2 "audit dbadm,sysadm,secadm using policy adminpol"
db2 terminate
The following SQL statement can be issued to verify if the policies are created and attached to the WORKER table and the admin authorities properly.
db2 "select trim(substr(p.AUDITPOLICYNAME,1,10)) AUDITPOLICYNAME, EXECUTESTATUS, ERRORTYPE,substr(OBJECTSCHEMA,1,10) as OBJECTSCHEMA, substr(OBJECTNAME,1,10) as OBJECTNAME from SYSCAT.AUDITPOLICIES p,SYSCAT.AUDITUSE u where p.AUDITPOLICYNAME=u.AUDITPOLICYNAME and p.AUDITPOLICYNAME in ('WORKTABPOL','ADMINPOL')"
Figure 2. Audit policy setup in the database
Once the audit setup is complete, you need to extract the details into a readable file. This contains all the execution logs whenever the WORKER table is accessed by any user from any SQL statement. You can run the following bash script periodically using CRON scheduler. This identifies events where the WORKER table is being accessed as part of any SQL statement by any user to populate worker_audit.log file which will be in a readable format.
#!/bin/bash
. /home/db2inst1/sqllib/db2profile
cd /home/db2inst1/dbaudit/archive
db2audit flush
db2audit archive database testdb
if ls db2audit.db.TESTDB.log* 1> /dev/null 2>&1; then
latest_audit=`ls db2audit.db.TESTDB.log* | tail -1`
db2audit extract file worker_audit.log from files $latest_audit
rm -f db2audit.db.TESTDB.log*
fi
Publish database audit and diagnostics Logs to CloudWatch Logs
The CloudWatch Log agent uses a JSON configuration file located at /opt/aws/amazon-cloudwatch-agent/bin/config.json. You can edit the JSON configuration as a root user and provide the following configuration details manually. For more information, refer to the CloudWatch Agent configuration file documentation. Based on the setup in your environment, modify the file_path location in the following configuration along with any custom values for the log group and log stream names which you specify.
{ "agent": { "run_as_user": "root" }, "logs": { "logs_collected": { "files": { "collect_list": [ { "file_path": "/home/db2inst1/dbaudit/archive/worker_audit.log", "log_group_name": "db2-db-worker-audit-log", "log_stream_name": "Db2 - {instance_id}" }, { "file_path": "/home/db2inst1/sqllib/db2dump/DIAG0000/db2diag.log", "log_group_name": "db2-diagnostics-logs", "log_stream_name": "Db2 - {instance_id}" } ] } } } }
This configuration specifies the file path which needs to be published to CloudWatch Logs along with the CloudWatch Logs group and stream name details as provided in the file. We publish the audit log which was created earlier as well as the Db2 Diagnostics log which gets generated on the Db2 server, generally used to troubleshoot database issues. Based on the config file setup, we publish the worker audit log file with log group name db2-db-worker-audit-log and the Db2 diagnostics log with db2-diagnostics-logs log group name respectively.
You can now run the following command to start the CloudWatch Log agent which was installed on the EC2 instance as part of the Prerequisites.
sudo /opt/aws/amazon-cloudwatch-agent/bin/amazon-cloudwatch-agent-ctl -a fetch-config -m ec2 -c file:/opt/aws/amazon-cloudwatch-agent/bin/config.json -sCreate SNS Topic and subscription
To create an SNS topic, complete the following steps:
- On the Amazon SNS console, choose Topics in the navigation pane.
- Choose Create topic.
- For Type, select Standard.
- Provide the Topic name and other necessary details as per your requirements.
- Choose Create topic.
After you create your SNS topic, you can create a subscription. Following are the steps to create the subscription.
- On the Amazon SNS console, choose Subscriptions in the navigation pane.
- Choose Create subscription.
- For Topic ARN, choose the SNS topic you created earlier.
- For Protocol, choose Email. Other options are available, but for this post we create an email notification.
- For Endpoint, enter the email address to receive event notifications.
- Choose Create subscription. Refer to the following screenshot for an example:
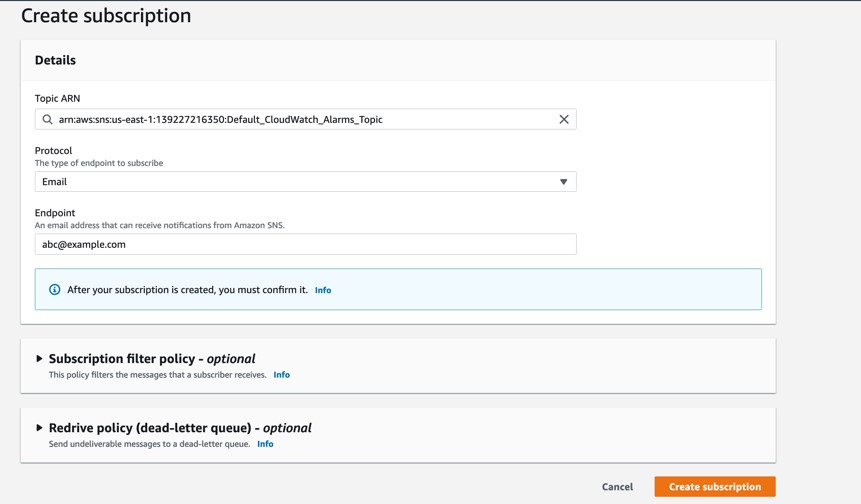
Figure 3. Create SNS subscription
Create metric filters and CloudWatch alarm
You can use a metric filter in CloudWatch to create a new metric in a custom namespace based on a filter pattern. Create a metric filter for db2-db-worker-audit-log log using the following steps.
To create a metric filter for the db2-db-worker-audit-log log stream:
- On the CloudWatch console, under CloudWatch Logs, choose Log groups.
- Select the Log group db2-db-worker-audit-log.
- Choose Create metric filter from the Actions drop down as shown in the following screenshot.

Figure 4. Create Metric filter
- For Filter pattern, enter “worker – appusr” to filter any user access on the WORKER table in the database except the authorized user appusr.
This means that only appusr user is allowed to query WORKER table to access the data. If there is an attempt to grant permissions on the table to any other user or access is being attempted by any other user, these actions are monitored. Choose Next to navigate to Assign metric step as shown in the following screenshot.
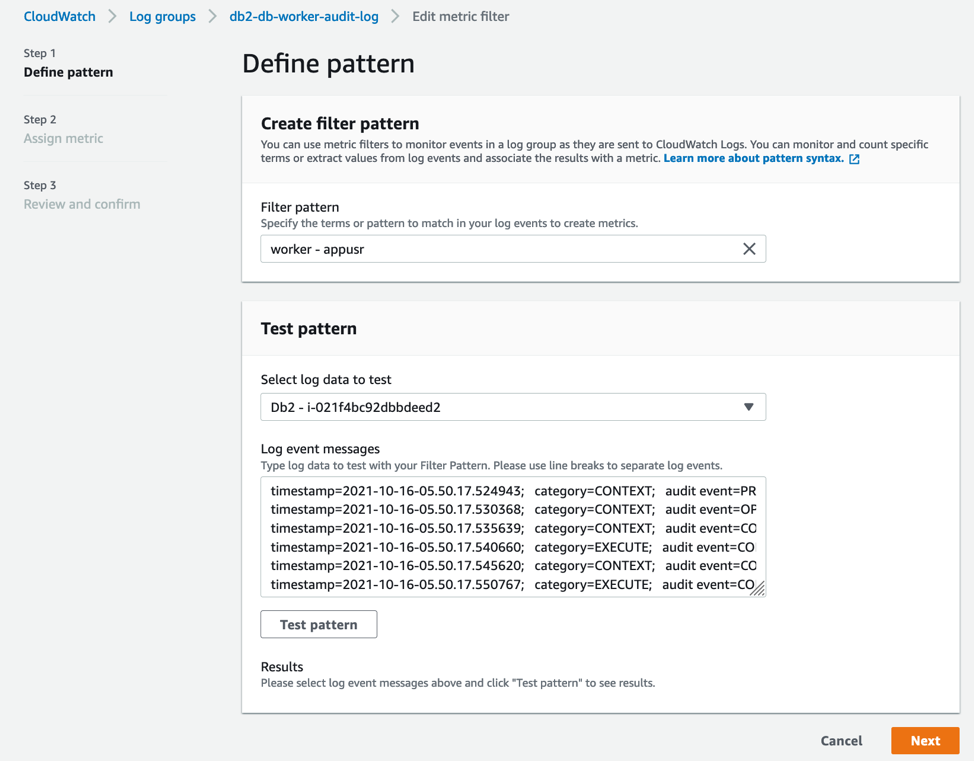
Figure 5. Define Metric filter
- Enter Filter name, Metric namespace, Metric name and Metric value as provided and choose Next as shown in the following screenshot.
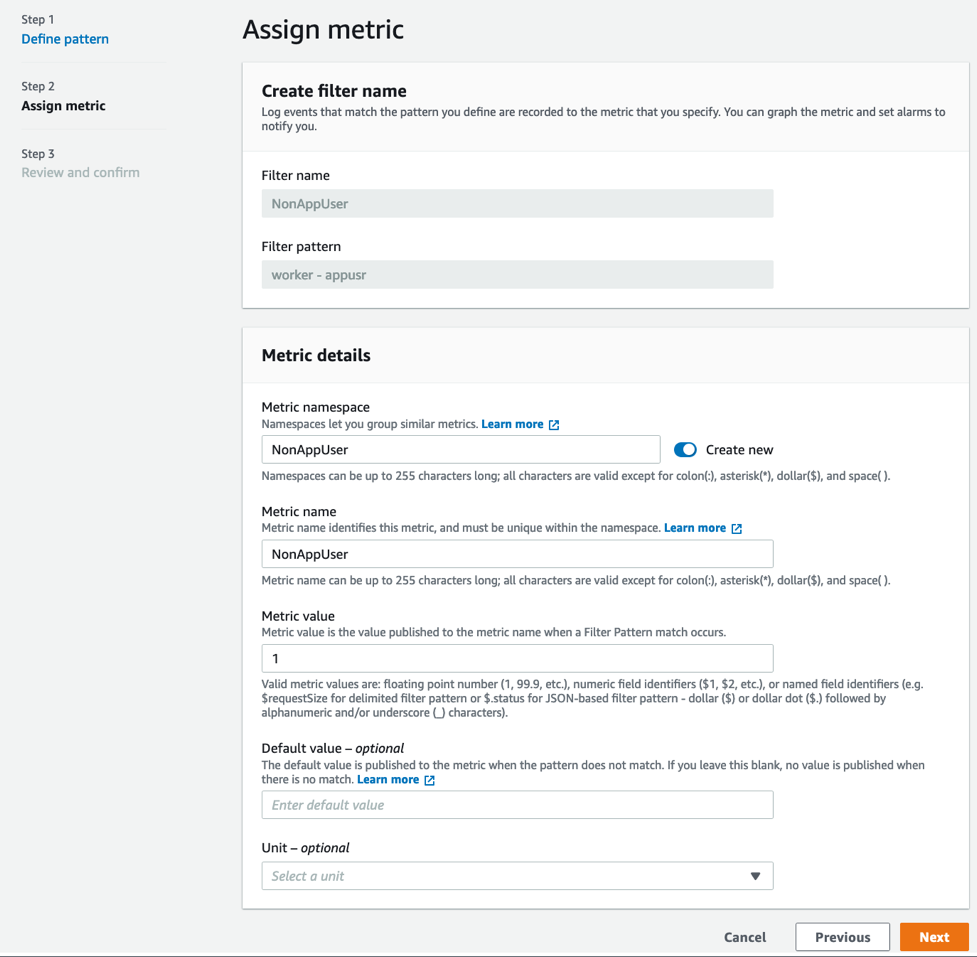
Figure 6. Assign Metric
- Choose Create Metric Filter from the next page.
- Now, select the new Metric filter you just created from the Metric filters tab and choose Create alarm as shown in the following screenshot.
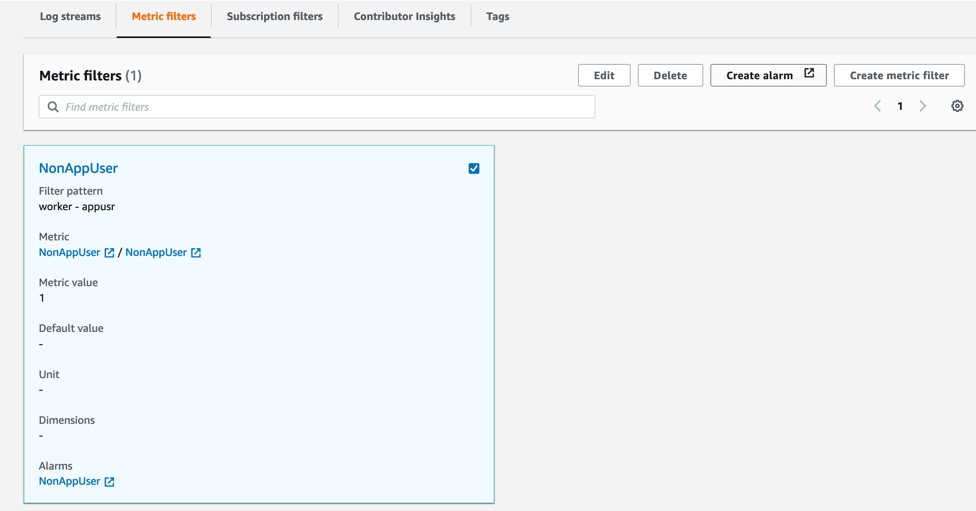
Figure 7. Create alarm
- Choose Minimum under Statistic, Period as per your choice, say 10 seconds and Threshold value as 0 as shown in the following screenshot.
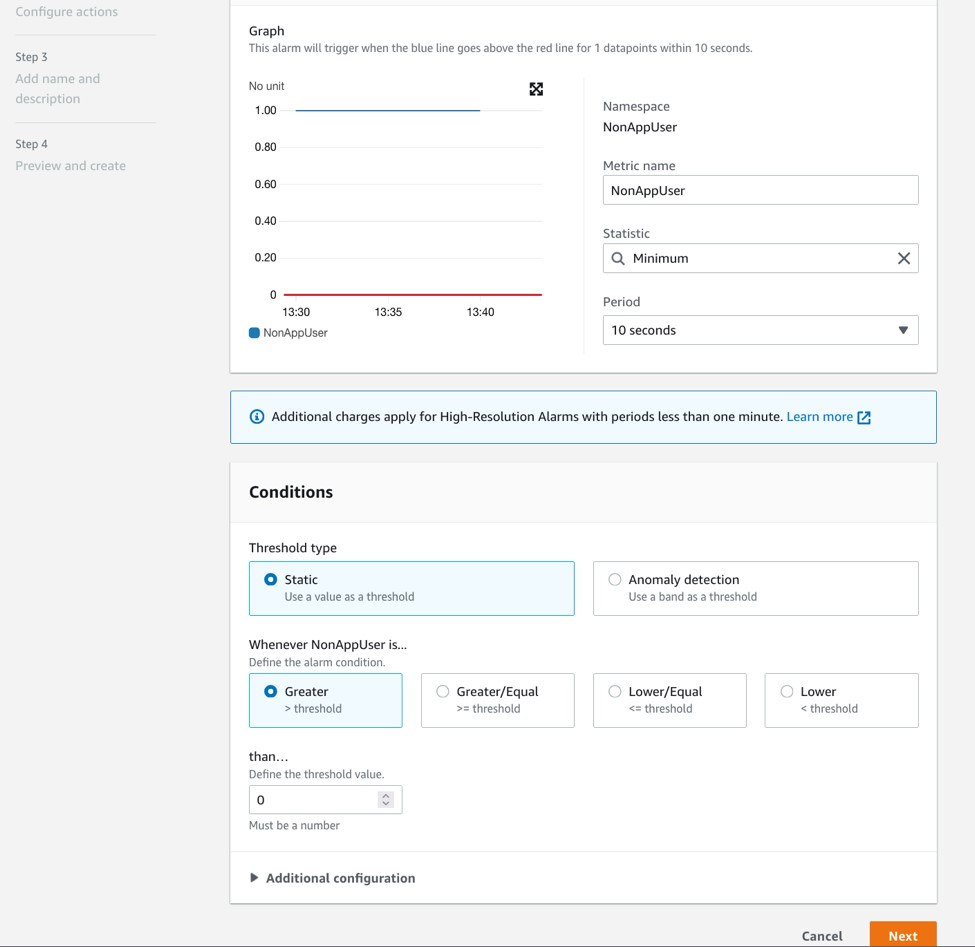
Figure 8. Configure actions
- Choose Next and under Notification screen. select In Alarm under Alarm state trigger option.
- Under Send a notification to search box, select the SNS Topic you have created earlier to send notifications and choose Next.
- Enter the Filter name and choose Next and then finally choose Create alarm.
To create metric filter for db2-diagnostics-logs log stream:
Follow the same steps as earlier to create the Metric filter and alarm for the CloudWatch Log group db2-diagnostics-logs. While creating the Metric filter, enter the Filter pattern “?Error?Severe” to monitor Log level that are ‘Error’ or ‘Severe’ in nature from the diagnostics file and get notified during such events.
Testing the solution
Let’s test the solution by running a few commands and validate if notifications are being sent appropriately.
To test audit notifications, run the following grant statement against the WORKER table as system admin user or database admin user or the security admin user, depending on the user authorization setup in your environment. For this post, we use db2inst1 (system admin) to run the commands. Since the WORKER table has sensitive data, the DBA does not issue grants against the table to any other user apart from the authorized appusr user.
Alternatively, you can also issue a SELECT SQL statement against the WORKER table from any user other than appusr for testing.
db2 "grant select on table sample.worker to user abcuser, role trole"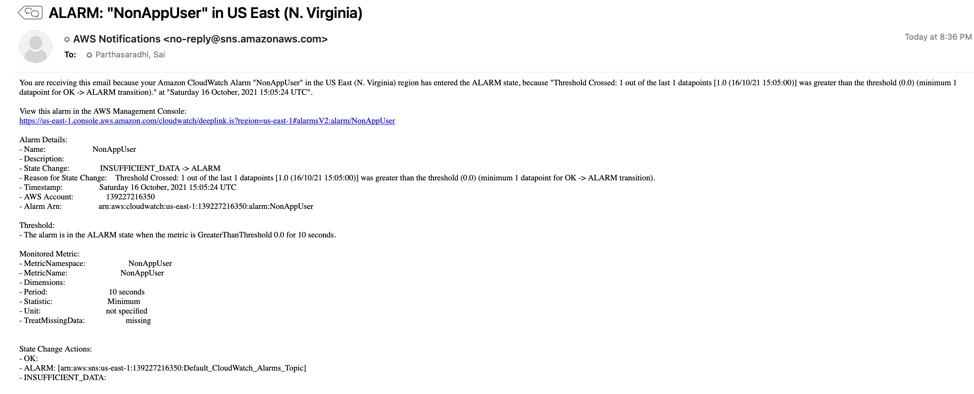
Figure 9. Email notification for audit monitoring
To test error notifications, we can simulate db2 database manager failure by issuing db2_kill from the instance owner login.

Figure 10. Issue db2_kill on the database server
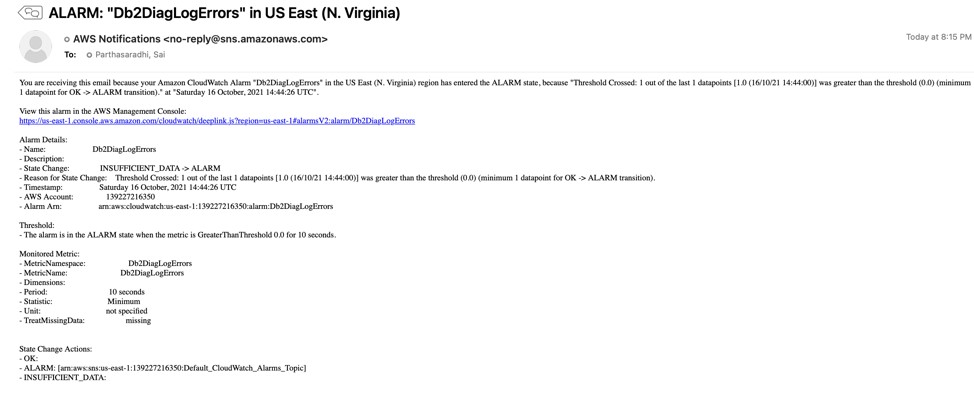
Figure 11. Email notification for error monitoring
Clean up
Shut down the Amazon EC2 instance which was created as part of the setup outlined in this blog post to avoid any incurring future charges.
Conclusion
In this post, we showed you how to set up Db2 database auditing on AWS and set up metric alerts and alarms to get notified in case of any unknown access or unauthorized actions. We used the audit logs and monitor errors from Db2 diagnostics logs by publishing to CloudWatch Logs.
If you have a good understanding on specific error patterns in your system, you can use the solution to filter out specific errors and get notified to take the necessary action. Let us know if you have any comments or questions. We value your feedback!