Today, we’re announcing two significant enhancements to AWS Lambda that make it easier than ever for developers to build and debug serverless applications in their local development environments: console to IDE integration and remote debugging. These new capabilities build upon our recent improvements to the Lambda development experience, including the enhanced in-console editing experience and the improved local integrated development environment (IDE) experience launched in late 2024.
When building serverless applications, developers typically focus on two areas to streamline their workflow: local development environment setup and cloud debugging capabilities. While developers can bring functions from the console to their IDE, they’re looking for ways to make this process more efficient. Additionally, as functions interact with various AWS services in the cloud, developers want enhanced debugging capabilities to identify and resolve issues earlier in the development cycle, reducing their reliance on local emulation and helping them optimize their development workflow.
Console to IDE integration
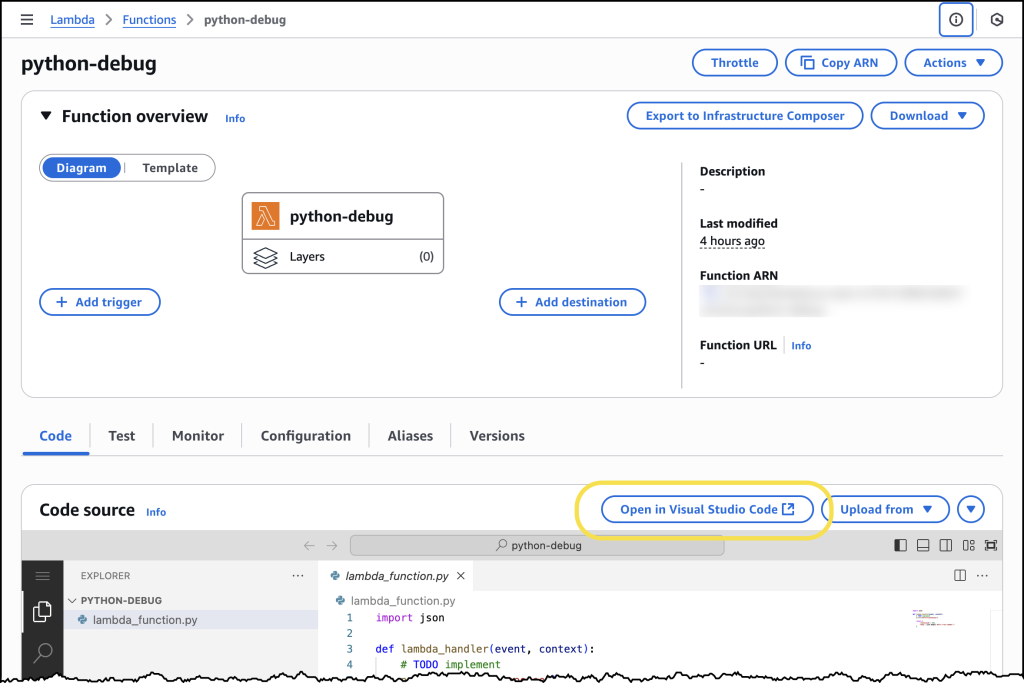
To address the first challenge, we’re introducing console to IDE integration, which streamlines the workflow from the AWS Management Console to Visual Studio Code (VS Code). This new capability adds an Open in Visual Studio Code button to the Lambda console, enabling developers to quickly move from viewing their function in the browser to editing it in their IDE, eliminating the time-consuming setup process for local development environments.
The console to IDE integration automatically handles the setup process, checking for VS Code installation and the AWS Toolkit for VS Code. For developers that have everything already configured, choosing the button immediately opens their function code in VS Code, so they can continue editing and deploy changes back to Lambda in seconds. If VS Code isn’t installed, it directs developers to the download page, and if the AWS Toolkit is missing, it prompts for installation.
To use console to IDE, look for the Open in VS Code button in either the Getting Started popup after creating a new function or the Code tab of existing Lambda functions. After selecting, VS Code opens automatically (installing AWS Toolkit if needed). Unlike the console environment, you now have access to a full development environment with integrated terminal – a significant improvement for developers who need to manage packages (npm install, pip install), run tests, or use development tools like linters and formatters. You can edit code, add new files/folders, and any changes you make will trigger an automatic deploy prompt. When you choose to deploy, the AWS Toolkit automatically deploys your function to your AWS account.
Remote debugging
Once developers have their functions in their IDE, they can use remote debugging to debug Lambda functions deployed in their AWS account directly from VS Code. The key benefit of remote debugging is that it allows developers to debug functions running in the cloud while integrated with other AWS services, enabling faster and more reliable development.
With remote debugging, developers can debug their functions with complete access to Amazon Virtual Private Cloud (VPC) resources and AWS Identity and Access Management (AWS IAM) roles, eliminating the gap between local development and cloud execution. For example, when debugging a Lambda function that interacts with an Amazon Relational Database Service (Amazon RDS) database in a VPC, developers can now debug the execution environment of the function running in the cloud within seconds, rather than spending time setting up a local environment that might not match production.
Getting started with remote debugging is straightforward. Developers can select a Lambda function in VS Code and enable debugging in seconds. AWS Toolkit for VS Code automatically downloads the function code, establishes a secure debugging connection, and enables breakpoint setting. When debugging is complete, AWS Toolkit for VS Code automatically cleans up the debugging configuration to prevent any impact on production traffic.
Let’s try it out
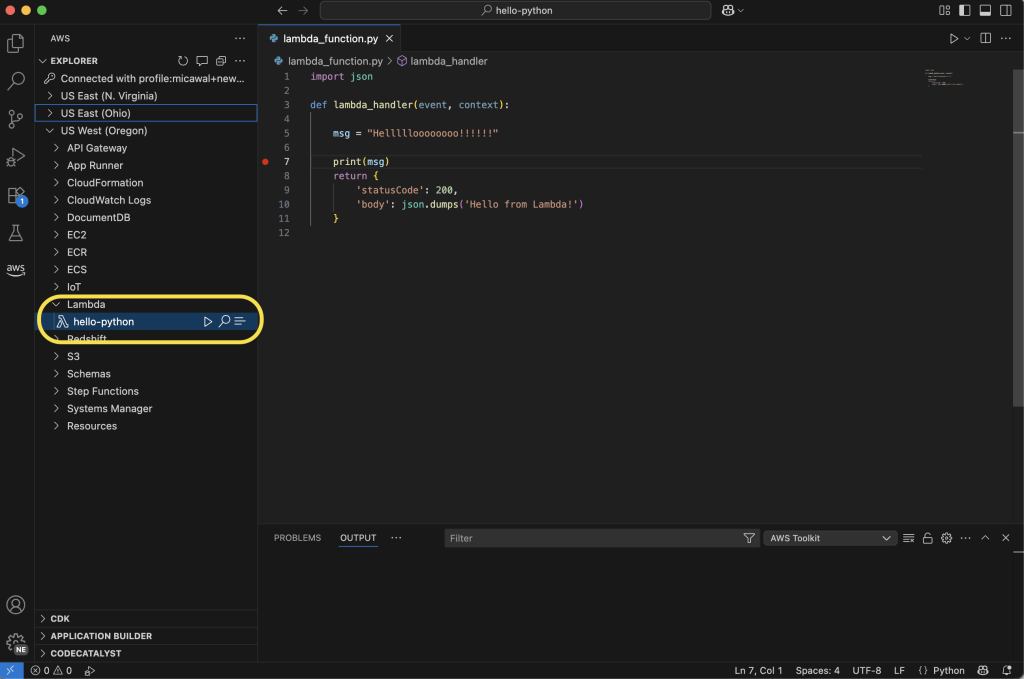
To take remote debugging for a spin, I chose to start with a basic “hello world” example function, written in Python. I had previously created the function using the AWS Management Console for AWS Lambda. Using the AWS Toolkit for VS Code, I can navigate to my function in the Explorer pane. Hovering over my function, I can right-click (ctrl-click in Windows) to download the code to my local machine to edit the code in my IDE. Saving the file will ask me to decide if I want to deploy the latest changes to Lambda.
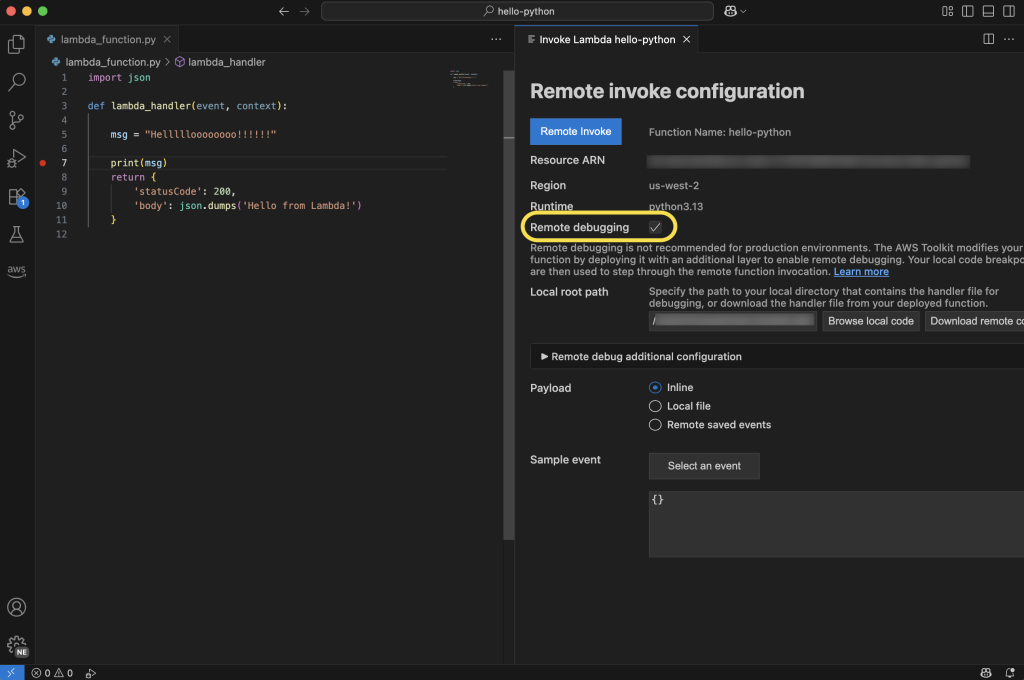
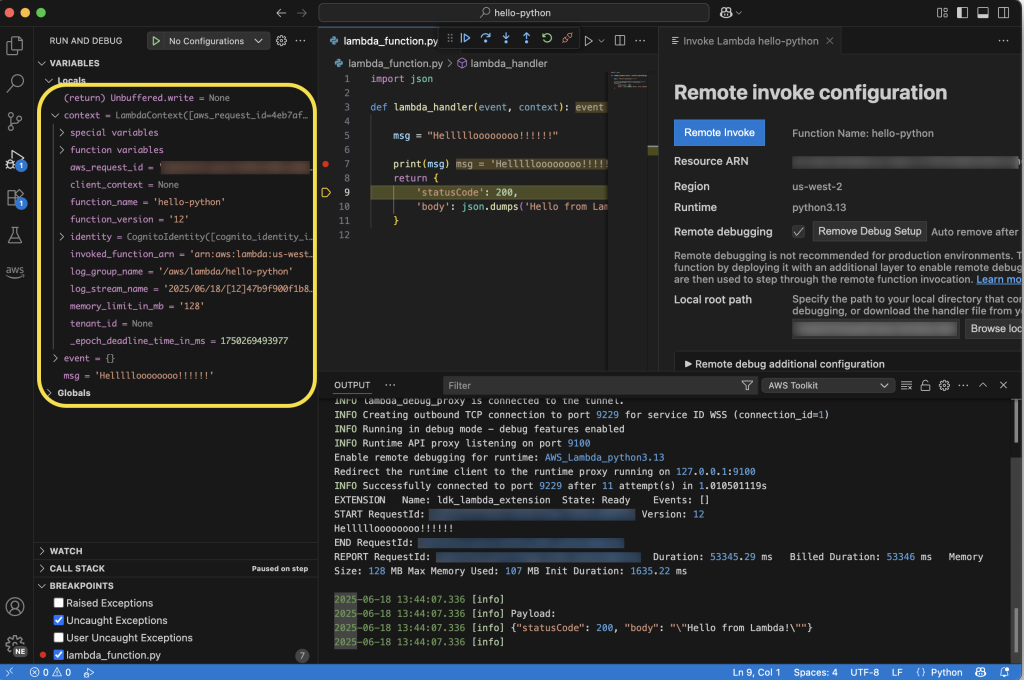
From here, I can select the play icon to open the Remote invoke configuration page for my function. This dialog will now display a Remote debugging option, which I configure to point at my local copy of my function handler code. Before choosing Remote invoke, I can set breakpoints on the left anywhere I want my code to pause for inspection.
My code will be running in the cloud after it’s invoked, and I can monitor its status in real time in VS Code. In the following screenshot, you can see I’ve set a breakpoint at the print statement. My function will pause execution at this point in my code, and I can inspect things like local variable values before either continuing to the next breakpoint or stepping into the code line by line.
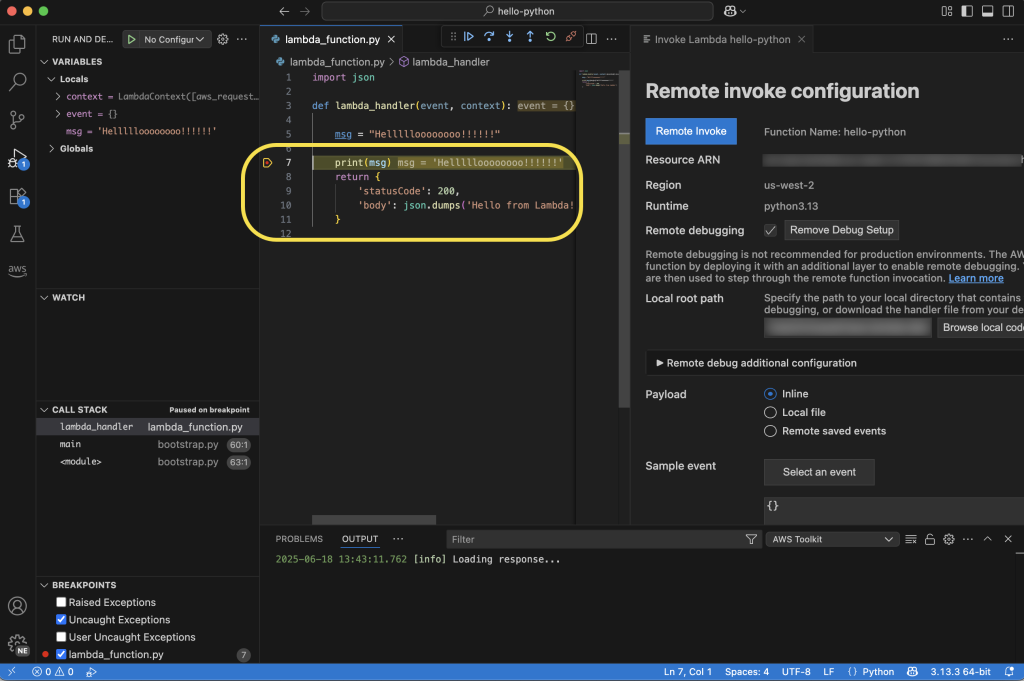
Here, you can see that I’ve chosen to step into the code, and as I go through it line by line, I can see the context and local and global variables displayed on the left side of the IDE. Additionally, I can follow the logs in the Output tab at the bottom of the IDE. As I step through, I’ll see any log messages or output messages from the execution of my function in real time.
Enhanced development workflow
These new capabilities work together to create a more streamlined development experience. Developers can start in the console, quickly transition to VS Code using the console to IDE integration, and then use remote debugging to debug their functions running in the cloud. This workflow eliminates the need to switch between multiple tools and environments, helping developers identify and fix issues faster.
Now available
You can start using these new features through the AWS Management Console and VS Code with the AWS Toolkit for VS Code (v3.69.0 or later) installed. Console to IDE integration is available in all commercial AWS Regions where Lambda is available, except AWS GovCloud (US) Regions. Learn more about it in Lambda and AWS Toolkit for VS Code documentation. To learn more about remote debugging capability, including AWS Regions it is available in, visit the AWS Toolkit for VS Code and Lambda documentation.
Console to IDE and remote debugging are available to you at no additional cost. With remote debugging, you pay only for the standard Lambda execution costs during debugging sessions. Remote debugging will support Python, Node.js, and Java runtimes at launch, with plans to expand support to additional runtimes in the future.
These enhancements represent a significant step forward in simplifying the serverless development experience, which means developers can build and debug Lambda functions more efficiently than ever before.