API gateways are part of every modern microservice architecture. As their name already suggests, they are the gateway into your system; everyone who wants to access your service has to go through a gateway.
In 2019, AWS announced HTTP APIs for its API Gateway (APIG) service. This was a big step to add more flexibility and lower latency to APIG.
Before this release, you could only build REST APIs with APIG, which only helped when you wanted to create an API based on the REST architecture. In every other case, it was a burden because you had to bend all the REST configurations to fit your architecture model.
With HTTP APIs, AWS gave its customers a low-level tool. You can take an architecture pattern, like AsyncAPI, to build your gateway. The more you can do, the more you can do wrong.
So, it’s nice to know that Dashbird now supports the monitoring of HTTP APIs built with APIG.
This article will look at why and how to monitor HTTP APIs and how Dashbird will help you do that.
Why Should You Monitor Your HTTP APIs?
As you already know, API gateways are the entry to your system. This means at least two things:
- An API gateway is a liability because all bad things entering your system will go through.
- Since all data goes through an API gateway, it’s the perfect location to measure.
If a malicious user wants to attack your system, they need some way to enter your system. If you didn’t configure your APIG correctly, this could create this entry. And this doesn’t just mean you allowed anonymous users to access routes they aren’t supposed to use. It can also mean you attached confidential data to URLs, which got logged somewhere.
The same goes for allowing all data to enter your system without validation or sanitation. If a user can send anything to your system and processes it without further thought, you can quickly end up with corrupt data or crashed services.
Monitoring your HTTP APIs helps you to get insights into such problems. If things go wrong in production, and your service is on the other side of the planet, you might not have the time to comb through hundreds of log lines; you need a sophisticated monitoring system that quickly tells you what happened.
Modern services also aren’t static. They change over time, and your first implementation is never the best. You iterate with user feedback and technical feedback from your monitoring tools.
If a user tells you about a bad user experience because your system is slow, you need to know why it’s slow. Pouring hours or days into optimizing your database queries when your HTTP API was the laggard isn’t something you want to waste your time with.
Costs are also a huge factor, especially in the AWS cloud, where you pay for all the traffic out of your system. If you always send massive JSON objects around but just use 10% of their data in the UI, you leave money on the table.
Monitoring your HTTP APIs can transform your decision process with actionable information instead of guessing around user complaints and high bills. These gateways’ central spot in your architecture makes them the perfect place to gather all the necessary metrics for meaningful iterations.
How to Monitor Your HTTP APIs?
With its latest release, Dashbird added support for APIG’s HTTP APIs. All your HTTP APIs are automatically monitored after installing Dashbird into your AWS account. You need to deploy a CloudFormation template to set up Dashbird integration; it doesn’t require any code changes!
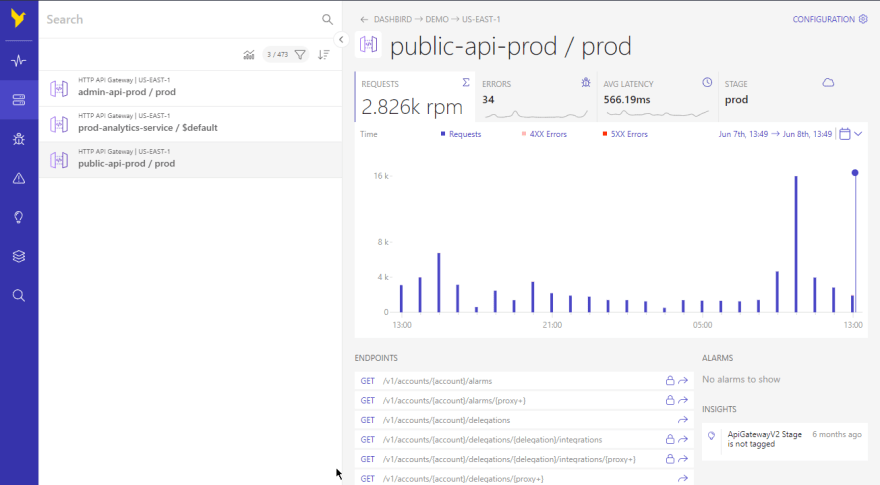
In figure 1, you can see what Dashbird monitors out of the box. Requests per minute, errors, and latency for all your HTTP APIs. You also get a list of all endpoints, with explanations about their authentication mechanisms and if they are redirects.
Dashbird extracts all errors directly from CloudWatch Logs. This way, you can save a lot of time combing through logs manually while ensuring nothing goes missing.
Figure 1: Dashbird’s HTTP API monitoring
Dashbird Insights
Dashbird also comes with a bunch of insights for your HTTP APIs. These are taken directly from the AWS Well-Architected Framework, so you know at one glance if you’re following AWS best practices when building your serverless systems. Insights let you be proactive; they will notify you before a problem impacts your users.
Figure 2 shows the insights category filtered by “http api.” This filter helps you to focus on one service at a time. The Insights come with some details about the issue and why you might want to fix it.
Figure 2: Dashbird Insights for HTTP APIs
Dashbird Alarms
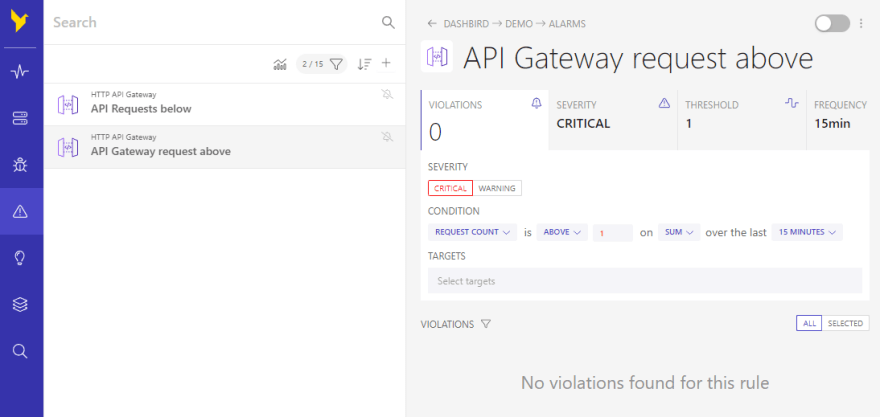
If you want to get notified when things don’t go as planned, you can use Dashbird’s trusty alarms feature, which will send you notifications on a channel of your choice. If you look at figure 3, you see an HTTP API alarm that will trigger when too many requests are hitting your endpoints.
Dashbird currently supports email, Amazon SNS, Slack, and webhooks as notification channels.
Figure 3: Dashbird alarms for HTTP APIs
Summary
Dashbird’s new API Gateway integration for HTTP APIs brings all the goodies you know from other services.
Monitoring HTTP APIs is a breeze when you don’t have to wade through thousands of log lines when encountering problems with your architecture. With Dashbird’s alarms, you can get notified right away, and Insights even go a step further by helping you to follow AWS’ best practices and telling you things might go wrong in the future.
Since Dashbird is built on top of AWS services like CloudWatch Logs, you get all these supporting features without writing a single line of code or changing your system. Just deploy the CloudFormation template, and Dashbird will monitor all your existing systems for you.


