Amazon Web Services Feed
How KPMG Visualizes Cloud Billing Data with Amazon QuickSight

By Stephanie Gooch, Sr. DevOps Engineer, Enablement at KPMG Solutions and Digital
 |
 |
The AWS Cost and Usage Report is the most granular cost report Amazon Web Services (AWS) has. It is more than 200 columns wide, and can have billions of rows for a single month of charges.
It works well for smaller accounts, but larger accounts need a more advanced tool to accurately charge back their own customers.
For the last few years, KPMG has been using Amazon QuickSight to visualize the billing data in the AWS Cost and Usage Report. The machine learning (ML) insights in Amazon QuickSight shed light on where and why KPMG was spending money in the cloud.
KPMG is an AWS Partner Network (APN) Advanced Consulting Partner and global network of professional firms that provide audit, tax, technology, and advisory services.
In this post, I will show you how KPMG uses Amazon QuickSight to break down the AWS Cost and Usage Report, and highlight some of our favorite features.
How KPMG Uses Amazon QuickSight
Amazon QuickSight creates and publishes interactive dashboards that include machine learning insights. You can access these dashboards from any device, and you can embed them into your applications, portals, and websites.
KPMG uses it as a business intelligence (BI) tool. Amazon QuickSight is simple to use, fast, and cheaper than comparable tools on the market. You pay only for what you use.
To put together KPMG’s approach, we followed the guidance of this Well-Architected Lab on GitHub. We used it to get started while retaining the freedom to use the key performance indicators (KPIs) that mattered to us.
As suggested by the lab, Cost and Usage Report data was stored in Amazon Simple Storage Service (Amazon S3). On top of S3, we stacked Amazon Athena because this combination enabled us to query the large sets of data. This includes data such as cloud charges, tooling charges for services KPMG hosts, and, most importantly, business connection data about who owns these costs.
Amazon Athena is an interactive query service that makes it easy to analyze data in Amazon S3 using standard SQL. Athena is serverless, so there is no infrastructure to manage. There’s also no need for complex extract-transform-load (ETL) jobs to prepare data for analysis. As with Amazon QuickSight, you pay only for the queries you run.
However, running queries can’t always give you comprehensive views or insights into your overall spend and usage. Therefore, connecting Amazon QuickSight to Athena seemed like the perfect solution. Because we accessed both services from the same AWS account, setup was simple and the two integrated seamlessly.
Another benefit of using Amazon QuickSight is that we were able to connect different data sets. This connection is similar to the join functionality in SQL, and there was the option of using either the user interface (UI) or application programming interface (API).
We used this capability to connect the hosting data mentioned earlier to individual KPMG teams through account IDs or tags, providing insights into data specific to each team.
Types of Data to Look For
These are some of the types of data that KPMG pays special attention to:
- AWS Service — A good general starting point for analyzing the Cost and Usage Report is finding out what tour overall spend on AWS services is. This information is similar to what AWS Cost Explorer provides, but doesn’t limit the number of services it shows.
- KPMG Projects — KPMG maps cost data to a set of tags to associate charges to teams, projects, or environments. This helps you drill down into the cloud costs incurred by individual teams to show what’s important to them.
- Cost Savings — We use Amazon QuickSight to highlight specific areas of cost savings, such as utilization of services or growth in unexpected areas. You can also use it to determine where it makes sense to purchase Reserved Instances (RI) or Savings Plans for Amazon Elastic Compute Cloud (Amazon EC2).
Reporting
Amazon QuickSight reporting sends you, on a regular basis, a snapshot of your dashboard. This gives teams a quick overview of what’s going on in their accounts, plus selected highlights.
Reporting also uses ML to spot anomalies in the data and notify teams so they can look into them. If needed, users can dive deeper and gather more information.
Creating Visualizations Through the User Interface
We’d like to share some simple visuals that have provided KPMG insight into Cost and Usage Reports through the Amazon QuickSight UI. You can create these same visuals using generic fields in the report. These visuals gave finance, developers, and business owners (the key beneficiaries of a FinOps culture) the ability to visualize data points so they can have open conversations with clear data.
With the release of the Amazon QuickSight API in November 2019, you can automate tasks such as tagging dashboards, creating data sources, and creating groups.
For now, we’ll focus on creating three visualizations through the Amazon QuickSight UI:
- Instance type distribution
- Reserved instance consumption
- Account spend by AWS service
Instance Type Distribution
Using the product_instance_type and line_item_unblended_costs fields, you can create a pie chart representation of the different types of instances used in your AWS account.

Figure 1 – Pie chart of different Amazon EC2 instance types in your AWS account.
You can further divide this data into database and instances by using the product_product_family as a filter.
This view helps you find information such as the instances that need to be upgraded, whether they comply with guidance of Reserved Instances or Savings Plan purchases, or to visualize how similar or different your company’s instances are.
Reserved Instance Consumption
If you are doing work with chargebacks or want to compare consumption between different months, you can visualize which of your accounts are consuming your Reserved Instances. Use these parameters:
line_item_usage_account_idreservation_reccuring_fee_for_usageline_item_product_code
Filter by line_item_line_item_type = DiscountedUsage in a stacked bar chart to see which accounts are using your Reserved Instances, and the type of instance they are using, as shown in Figure 2.

Figure 2 – Bar chart of accounts using your Reserved Instances, and the type of instance.
Account Spend by AWS Service
If you want visualize your costs by AWS service, select these two parameters for a bar chart:
line_item_product_codeline_item_unblended_costs
Then filter by line_item_usage_account_id if you would like a specific account. Otherwise, spend for your entire account is shown by default.
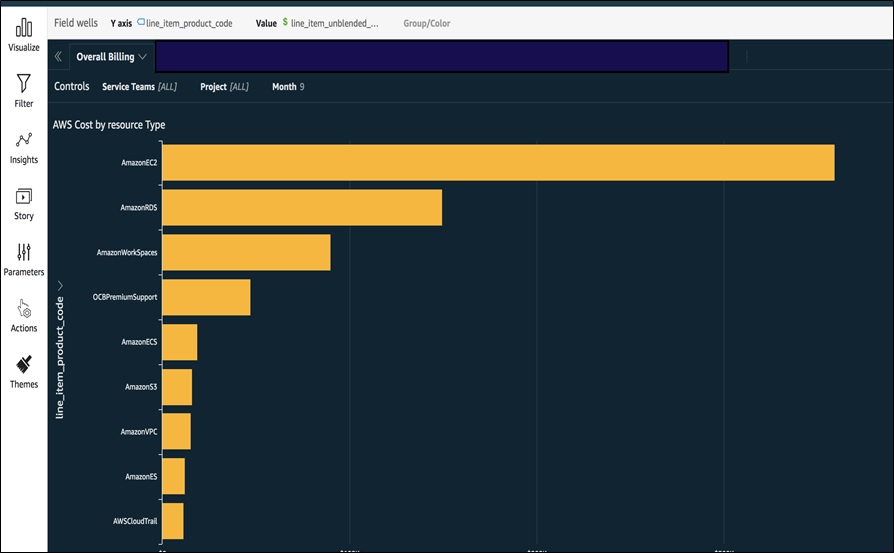
Figure 3 – Bar chart of account spend by AWS service.
This report looks like the AWS Cost and Usage Report, but by using the scroll bar on the right of your graph you can dive deeper and identify smaller costs you might not have been considering.
Using Controls in Dashboards
One last thing we’d like to point out is the use of controls in dashboards. These appear at the top of each of the previous screen shots, and allow you to dynamically filter what’s displayed in a dashboard. This is how KPMG applies the month field in a data set, for example, to review spend and usage for different months.
To set it up, follow these instructions.
Hopefully, these visuals have given you a view of how you can use AWS Cost and Usage Reports and Amazon QuickSight to get some useful insights into your accounts. To learn more, we recommend the step-by-step guides in the AWS Cost Optimizations Labs.
Worth Exploring
As Amazon QuickSight continues to develop and improve, these are two areas we are looking forward to exploring in the future.
Forecasting
In the current Cloud Financial Management (CFM) world, a recurring topic is how to forecast cloud spend. This is a tricky area due to its variability. However, with Amazon QuickSight’s ML algorithms, you can gain more insight into what future spend could be.
Having customizable narratives with your data means you could try different scenarios and see what would happen.
KPIs with Conditional Formatting
For KPMG’s spend, it’s our goal to develop KPIs to assess how the business is using cloud resources. To help with this, we’d like to use Amazon QuickSight conditional formatting.
It’s a simple idea, but its color-coded system highlights the insights KPMG is most interested in seeing. Using these along with reporting and anomalies identified by ML algorithms will mean a faster feedback loops for the business.
Conclusion
Before KPMG started using Amazon QuickSight, there was a real challenge in analyzing and linking to a vast set of spend and usage data. Although cloud-native cost tools are useful for small, individual analyses, for dealing with larger, interconnecting sets of data, they needed another tool.
A business intelligence tool like Amazon QuickSight, which is simple to use, cost effective, and flexible, gives KPMG valuable insights into AWS spend, and lets the organization create a plan of automated responses to cost- or usage-related events.
If you are new to Amazon QuickSight, follow the guidance in the AWS Well-Architected Cost Optimization Lab. It will give you a good foundation and enable you to learn the basics while helping you develop the skills to explore on your own.
.
.
KPMG – APN Partner Spotlight
KPMG is an APN Advanced Consulting Partner. They combine deep technical cloud knowledge and consultancy capabilities, proven industry domain skills with extensive regulatory and compliance knowledge to deliver purpose-built AWS solutions.
Contact KPMG | Practice Overview
*Already worked with KPMG? Rate this Partner
*To review an APN Partner, you must be an AWS customer that has worked with them directly on a project.